SRAM (via Exosite) · Sole designer & front-end developer · 2014
Forty days. Twenty athletes. One world championship.
- Problem
- Quarq power meters measured cycling performance to the watt, then kept the data on the device until the ride ended, out of reach of coaches calling pacing strategy, broadcasters telling the race story, and spectators tracking a rider they know.
- Solution
- One real-time platform serving three views from a shared data layer, stripped-down race essentials, a storytelling layer for broadcast, and a daily training view, with noisy GPS snapped to known route coordinates so ascent and standings stayed accurate.
- Stack
- Live on-bike telemetry visualized in a web app, designed and front-end-built solo in 40 days, debuted behind the IRONMAN World Championship telecast across dozens of athletes 140.6 miles at a time.
Quarq's power meters measured cycling performance with precision, but the data was locked in the device until the ride ended. The brief was to take it online in time for the IRONMAN World Championship. Forty days, 20 athletes, 104 miles, global broadcast. We shipped on time and the platform performed without a hiccup.

Ironman Kona
live data behind the World Championship telecast
The problem

Quarq devices measured cycling power with precision. The data sat on the device until the rider got off the bike, which meant it was useful for analysis after the fact and useless during the ride itself. Competitive cyclists wanted to see and share their performance live. For a race like IRONMAN, the audience was bigger than the riders. Coaches calling pacing strategy. Sportscasters telling the story. Spectators trying to keep up with someone they knew on the course.
Project goals
Debut to a global IRONMAN audience. Visualization that worked for elite athletes and casual fans on a laptop. Daily-use product beyond race day. Track all three triathlon legs cleanly. Forty days, concept to ship.
Process
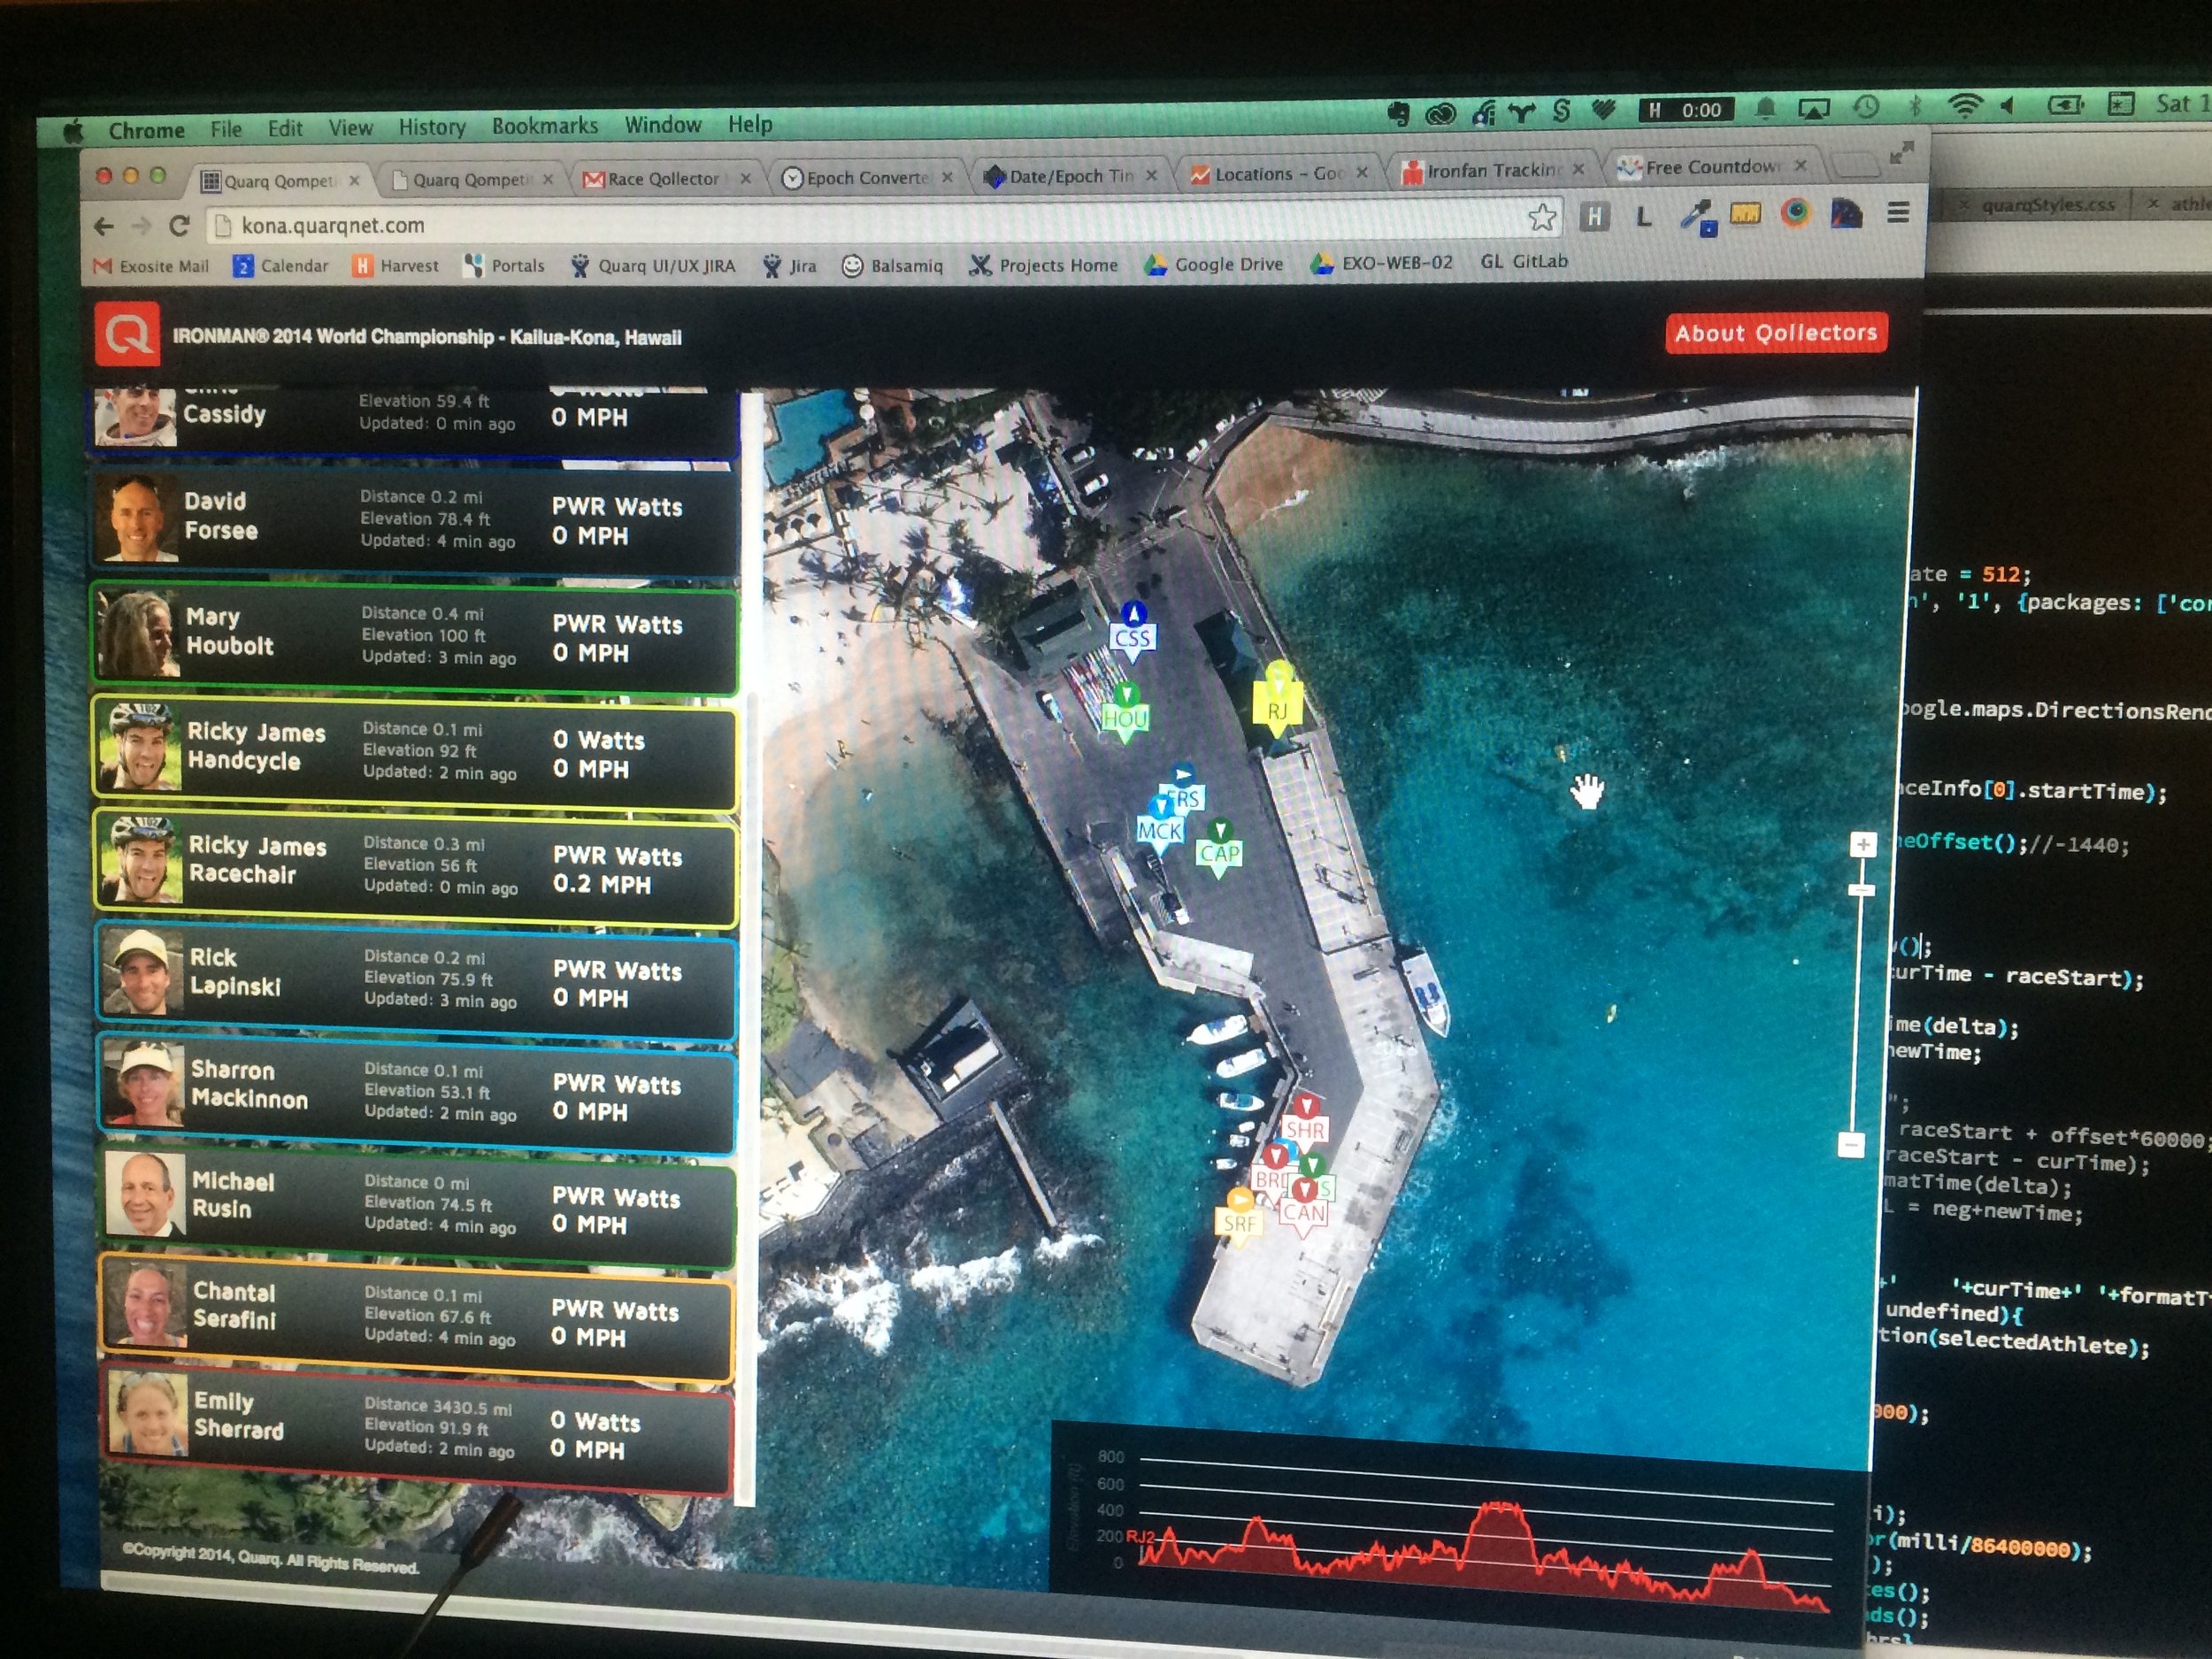
User interviews set the priority order. Testing surfaced the real problem fast. Reporting frequency dropped at sketchy GPS points and circuitous routing made athlete rankings jump unpredictably. Fixed it by snapping reported positions to a known set of route coordinates, which let us report accurate ascent and standings even when the raw data was noisy. The 40-day window was the design forcing function. Every decision had to earn its place against legibility at speed.
Forty days isn't a constraint. It's a clarifying agent. Every decision either serves legibility or it dies.
The design
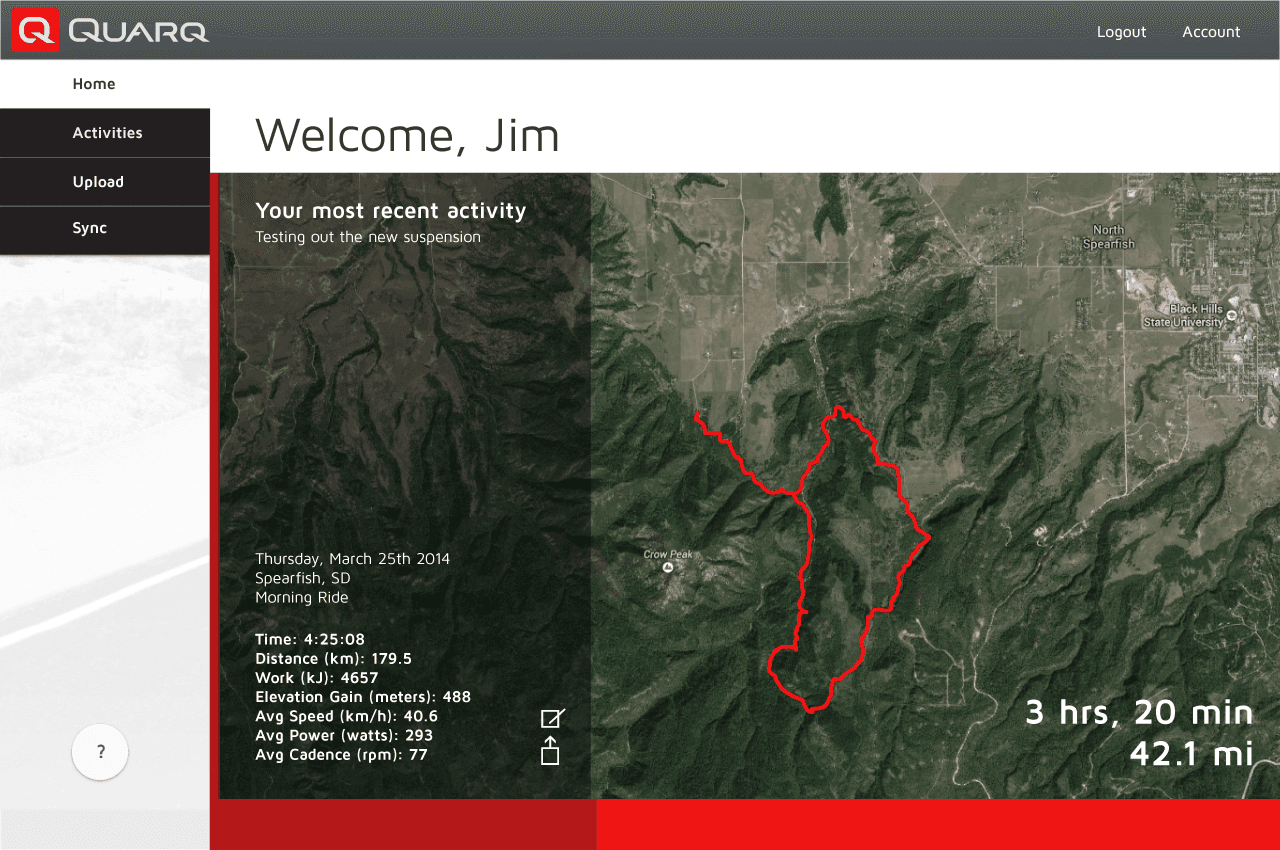
Race view, broadcast view, daily-rider view. One platform, three audiences. The race view stripped down to essentials. Position, power, gap to next rider, leg progress. Broadcast view layered storytelling. Pre-race expectations vs current performance. Daily view turned into a personal training tool. Each view shared the same data layer, so the broadcast and the rider were never looking at different numbers.
Results
Web app debuted at IRONMAN World Championships in Hawaii. Real-time monitoring across 20 athletes and 104 miles. Flawless. Performance sustained across subsequent races globally and in daily training use after the event. The platform shipped to a deadline most teams would have negotiated.
Next case study
Speculative / Portfolio
Shoebox. eCommerce UX Framework